Electrocardiogram
Original Editor Uchechukwu Chukwuemeka
Top Contributors - Uchechukwu Chukwuemeka, Kim Jackson, Lucinda hampton, Ayelawa Samuel, Karen Wilson and Rishika Babburu
Introduction[edit | edit source]
An electrocardiogram also termed an ECG or EKG (K means kardia for heart in Greek) or a 12 lead ECG. is a simple test that records the heart's electrical activity[1]. The ECG machine is designed to recognise and record any electrical activity within the heart. It provides information about the function of the intracardiac conducting tissue of the heart and reflects the presence of cardiac disease through its electrical properties. Understanding ECG helps to understand how the heart works. With each heartbeat, an electrical impulse starts from the superior part of the heart to the bottom. The impulse prompts the heart to contract and pump blood.
Some heart problems are easier to diagnose when your heart is working hard and beating fast. During stress testing i.e. exercise ECG, exercise is used to make the heart work hard and beat fast while an EKG is done. If exercise can't be done, you'll be given medicine to make your heart work hard and beat faster[2]. Heart rate and blood pressure will also be monitored throughout the test period. It usually takes about 7 to 12 minutes to complete[2].
What ECG Test is used[edit | edit source]
ECG is used to
- detect bradycardia and tachycardia.
- determine if symptoms, such as chest pain, shortness of breath or palpitations are due to a heart problem[2].
- know steady or irregular heart rhythm.
- know the strength and timing of electrical signals as they pass through each part of your heart.
- detect other disorders that affect heart function.
- Study and detect many heart problems, such as heart attacks, arrhythmia, heart failure.
- asses coronary blood flow and heart valves integrity.
- monitor deeply-sedated patients and for consciously-sedated patients with compromised cardiovascular function.
- monitor some medications for the heart.
- The indications for exercise electrocardiography include to ascertain the correct exercise prescription, the investigation of angina and post-myocardial infarction assessment as well as the postoperative examination of bypass surgery[2].
Electrode and Lead[edit | edit source]
An electrode is a sensor (conductive pad) attached to the skin and enables recording of electrical currents. An ECG lead is a graphical description of the electrical activity of the heart created by reading several electrodes. This means that each ECG lead is gotten by analysing the electrical currents detected by several electrodes[1]. A 12-lead ECG is obtained using 10 electrodes. These 12 leads consists of limb leads and chest leads (percordial leads). For further reading see...
To better under why there are only 10 leads instead of 12 leads read about Einthoven's triangle and the heart's action potential generation. see also...
ECG PAPER[edit | edit source]
Procedures[edit | edit source]
The procedure will be explained to the patient and what is to be expected during testing will also be clearly communicated to the patient.
Electrode placement[edit | edit source]
Limb Sensor Application
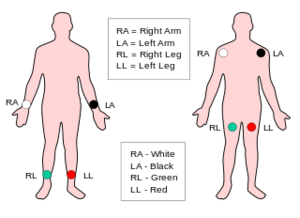
Place the 4 limb sensors on a smooth fleshy area of the lower inner forearm and lower inner legs, or upper inner arms and lower inner thighs, or upper inner arms and lower abdomen[3]. Attach the limb leads.
Chest Sensor Application
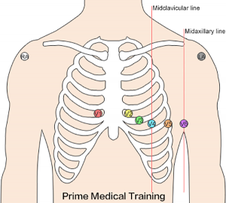
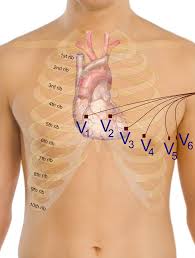
Place the 6 Chest sensors on the patient’s chest as follows:
V1 Fourth intercostal space at right border of the sternum
V2 Fourth intercostal space at left border of the sternum
V3 Midway between position V2 and position V4
V4 At the mid-clavicular line in the fifth intercostal space
V5 At the anterior axillary line on the same horizontal level as V4
V6 At the mid-axillary line on the same horizontal level as V4 and V5
Attach the chest leads.
To better under why there are only 10 leads instead of 12 leads read about
Stress test (Exercise electrocardiogram)[edit | edit source]
Before exercise commencement, the investigator will perform an EKG at a resting heart and also take blood pressure reading.
Conditions to end the test will be told to the patients and that they should inform the investigator if they feel any of the following:
- Chest or arm discomfort
- Short of breath
- Dizzy
- Lightheaded
- Any other unusual symptoms
At regular intervals, the lab personnel will ask how you are feeling.
It’s normal for your heart rate, blood pressure, breathing rate, and perspiration to increase during the test. The lab personnel will watch for anything on the EKG monitor that suggests the test should be stopped.
The patients starts the exercise at slow pace (e.g. walking on a treadmill or pedaling a stationary bicycle without resistance at a leisure pace). The intensity of the exercise will be gradually increased, until the patient feels exhausted. The patient then reverts back to slow walking pace or pedal slowly for a couple of minutes to cool down. The heart rate, blood pressure, and EKG will continue to be monitored until the levels begin returning to normal.
If medication is used, an IV will be inserted in on the arm in order to have the medication administered.
Interpretation of ECG waves[edit | edit source]
The ECG must always be interpreted systematically because failure to do so, may be detrimental. The step by step sequence of interpreting ECG make easy for anyone as well as reduces the chances of missing important abnormalities and also expedite the process.
1. Rhythm[edit | edit source]
Assess ventricular (RR intervals) and atrial (PP intervals) rate and rhythm by checking:
- ventricular rate (beats/min)
- regular or irregular ventricular rhythm
- atrial rate (beats/min)
- regular or irregular atrial rhythm
- P-waves should precede every QRS complex and the P-wave should be positive in lead II.
Possible findings
- Sinus rhythm (which is the normal heart rhythm) has the characteristics heart rate of 50–100 beats/minute,P-wave before every QRS complex and positive in lead II and also a constant PR interval.
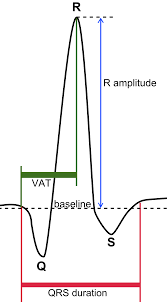
•The first wave (p wave) represents atrial depolarisation (ventricular filling)
•Q wave representing septal depolarisation
•R wave representing ventricular depolarisation
•S wave representing depolarisation of the Purkinje fibres
•QRS is ventricular depolarisation
•T wave is ventricular repolarisation
•ST segment is a flat line any change shows myocardial infarction
• P wave; QRS complex, and T wave show the 3phase of cardiac cycle in one heart beat
•Sinus arrhythmia, bradycardia, tachycardia, and asystole
•after the PQRST complex a U wave, seen electrolyte imbalance(potassium)
References[edit | edit source]
- ↑ 1.0 1.1 The ECG leads: electrodes, limb leads, chest (precordial) leads, 12-Lead ECG (EKG).https://ecgwaves.com/ekg-ecg-leads-electrodes-systems-limb-chest-precordial/ accessed on 14 Nov, 2018
- ↑ 2.0 2.1 2.2 2.3 Heart disease and stress.https://www.webmd.com/heart-disease/guide/stress-test#2 accessed on 14 Nov, 2018
- ↑ Khan GM. A new electrode placement method for obtaining 12-lead ECGs. Open Heart. 2015; 2(1): e000226. doi: 10.1136/openhrt-2014-000226
